About Us
Fundamentals-first stock research for retail investors
Over 90% of retail investors never check a company's fundamentals before buying. According to JP Morgan, most people trade based on headlines, social media, or whatever narrative is trending. They are buying a story, not a business. When the narrative changes, they panic and sell — because they have no data to fall back on.
I built the Stockpicker Stock Research Terminal because I needed it for myself.
Here is what most retail investors actually do
A 2025 NYU Stern study found that the average investor spends less than 6 minutes "researching" a stock. 61% of investors under 35 trade purely based on social media recommendations (FINRA, 2025). And 80% of people who call themselves value investors are not actually looking at numbers — they are trading momentum and chart patterns while calling it fundamentals.
This is not a skills problem. The data exists. It is just buried in 100-page earnings reports and scattered across spreadsheets that take hours to build. Most retail investors simply don't have the time or the tools to verify the actual health of a business before they buy.
That is the gap I built this terminal to close.
A real example: Google in 2025
The best way I can explain what Stockpicker does is through an example.
In 2025, the narrative was everywhere: Google is dead, AI search has already won. The stock dropped from $200 to $144. Most people saw a company in structural decline.
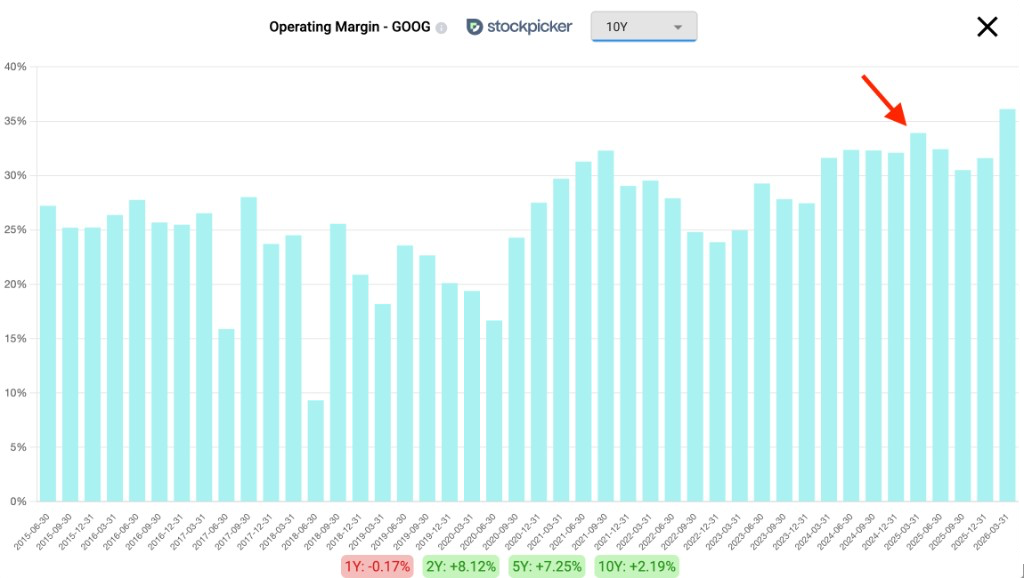
But if you opened the terminal and looked at the actual numbers, you would see a completely different picture. While the price was falling, the fundamentals were accelerating. Operating margin was not shrinking — it was hitting all-time highs, climbing from 29% to 32%.
Net income growth was not slowing down. It was speeding up.
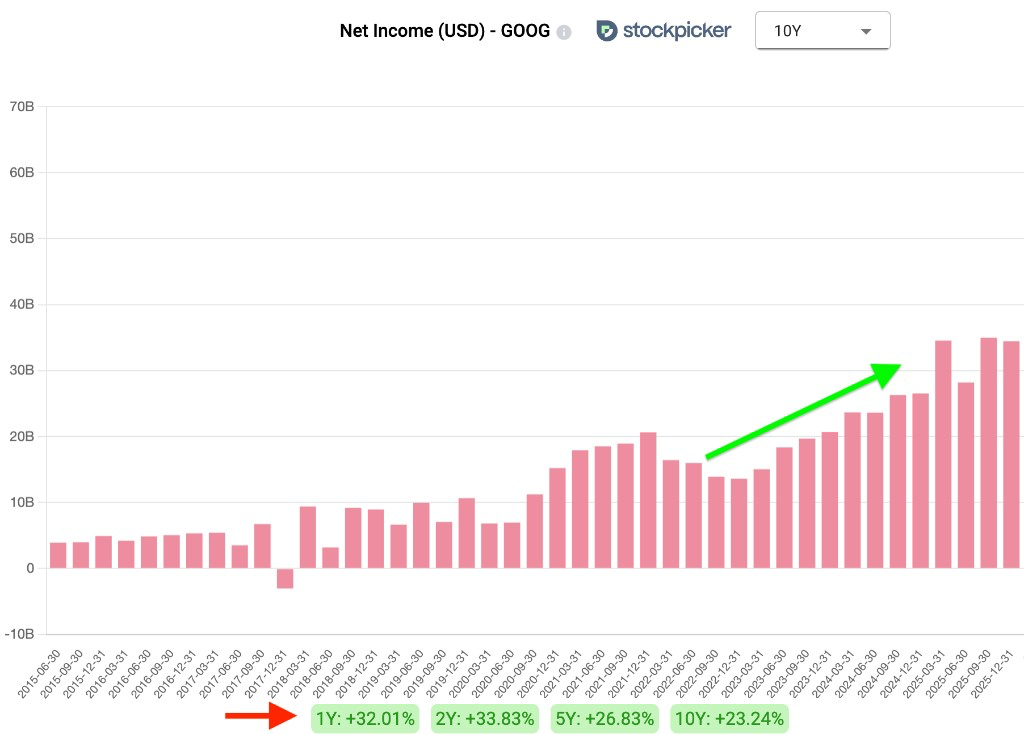
Disrupted businesses do not show those kinds of fundamentals. The narrative was wrong and the numbers made that clear.
I started buying in January and kept accumulating through August while most people were selling. Not because I had a gut feeling, but because every earnings report confirmed the same thing: the business was getting stronger while the stock was getting cheaper.
Four metrics I check on every stock
When I analyze a stock, I look at four things.
- Is revenue growing consistently over time, not just last quarter?
- Is net income tracking with revenue, or is the company growing sales while profits shrink?
- Are margins flat or expanding — because if revenue is going up but margins are going down, you are looking at a value trap.
- What does the debt look like? If a company cannot pay back its debt from its own earnings, I am not interested.
That is it. No complex models. No 100-page reports. If a business is compounding, you will see it clearly in those four metrics.

Kostadin Medarov
My name is Kostadin Medarov. I am a retail investor with 13 years of experience in management and business operations.
I am not a professional analyst and I am not building this for Wall Street. I built it because I needed a way to check the health of a business in 30 seconds, not 30 minutes. That tool did not exist for retail investors, so I built it myself.
If you want to analyze any stock, explore the terminal here.